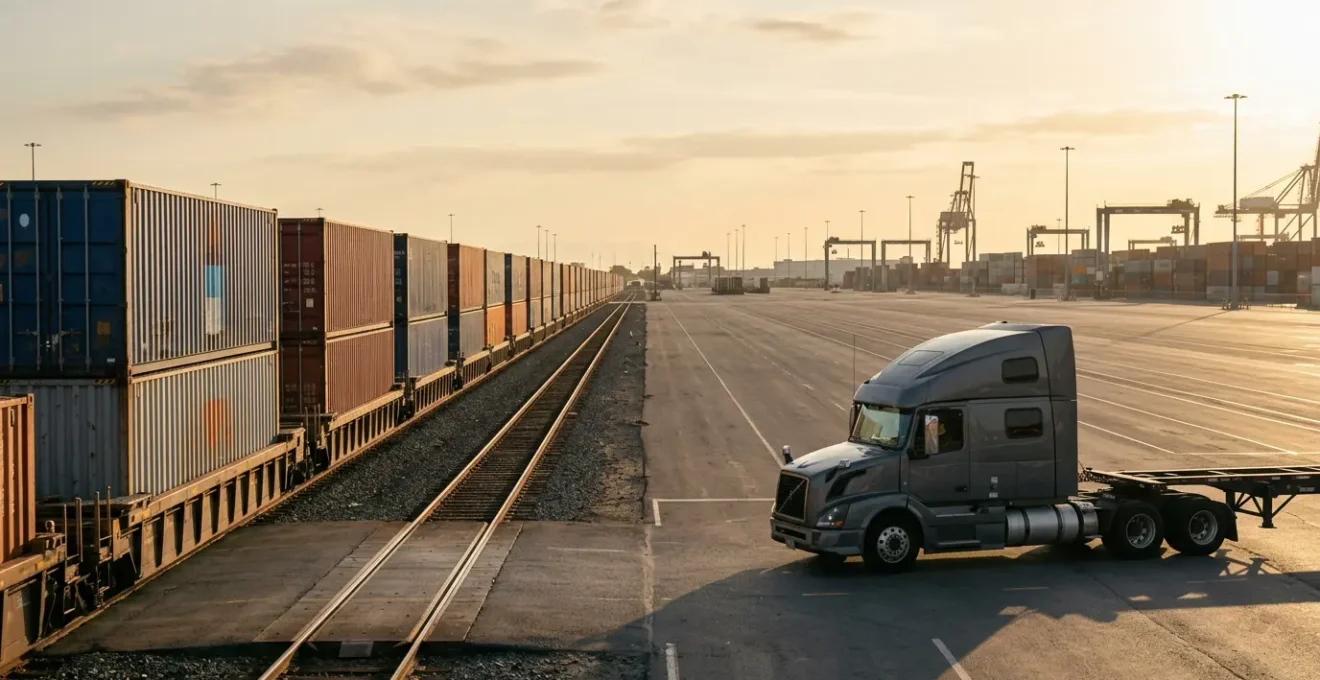
The true tipping point for intermodal savings isn’t a simple mileage rule; it’s the mastery of specific operational variables that are often overlooked.
- First and last-mile drayage isn’t just a cost center; it’s a strategic chokepoint where up to 20% of driver capacity can be lost without proper partner vetting.
- Optimizing container loading for rail-specific forces (shunting) and calculating cargo density are critical for preventing damage and maximizing cost-efficiency.
Recommendation: Shift your focus from « Is the lane long enough? » to « Is my operation robust enough to manage the drayage, loading, and scheduling levers that unlock intermodal’s true potential? »
For any logistics manager overseeing shipments over 1,000 miles, the pressure is constant: reduce costs, improve transit time reliability, and meet escalating sustainability targets. The conventional wisdom has always pointed towards a simple solution—shift long-haul freight from over-the-road (OTR) trucks to intermodal rail. The common refrain is that any lane over 750 miles is a prime candidate for rail, promising significant cost and carbon savings. While this rule of thumb holds a kernel of truth, it dangerously oversimplifies the equation.
Relying solely on distance as the decision-making trigger is a strategic error. It ignores the complex operational realities that determine whether an intermodal strategy succeeds or fails spectacularly. The genuine advantage isn’t found in the mileage alone, but in mastering the critical, and often hidden, variables of the entire door-to-door journey. These include the efficiency of the first- and last-mile drayage, the integrity of container loading practices, and the precision of railyard scheduling.
This guide moves beyond the platitudes. Instead of simply repeating that intermodal is cheaper and greener, we will dissect the operational levers that you, as a logistics manager, can pull to make it so. We will explore why the seemingly minor details of drayage partner selection, container packing, and asset synchronization are, in fact, the primary determinants of cost, speed, and success in any intermodal program. This is about transforming intermodal from a theoretical alternative into a powerful, predictable, and profitable part of your supply chain.
To navigate this strategic landscape, this article breaks down the core components that transform a standard intermodal shipment into a highly optimized logistical asset. The following sections will provide a detailed roadmap for evaluating and implementing a successful intermodal strategy.
Table of Contents: A Strategic Comparison of Rail and Truck Logistics
- Why the First and Last Mile Determine the Success of Intermodal Shipping?
- How to Load a Container for Rail to Prevent Damage from Shunting?
- Truck vs. Train: How Much CO2 Do You Actually Save per Ton-Mile?
- The Scheduling Mistake That Leaves Your Cargo Stuck at the Railyard
- When to Use 53-foot Containers: The Density Calculation That Saves Money?
- Air Freight vs. Sea Freight: Which Is Best for Heavy Transmission Batches?
- The « Deadhead » Mistake That Wastes 30% of Your Fuel Budget
- How to Cut Supply Chain Emissions by 20% While Lowering Costs?
Why the First and Last Mile Determine the Success of Intermodal Shipping?
The long, middle portion of an intermodal journey—the rail segment—is often the most efficient and predictable part. The real complexity, cost, and potential for crippling delays lie at the beginning and end: the first- and last-mile drayage. These short truck hauls to and from the railyard are where drayage friction can erode any savings gained on the rail line. The success of your entire intermodal strategy hinges on the performance of your drayage partners and their ability to navigate congested terminals and secure critical equipment like chassis.
The availability of a chassis is a primary failure point. When a driver arrives at a terminal to pick up a container and no chassis is available, it triggers a cascade of costly delays. The driver may have to « bobtail » (drive a tractor without a trailer) to another facility to find a chassis, a process that burns time and fuel. In fact, research from the Intermodal Association of North America shows that nearly 20% of daily driver capacity can be consumed in chassis repositioning alone. For a logistics manager, this means that what looks like a simple pickup can quickly turn into a multi-hour ordeal that jeopardizes delivery schedules and inflates costs.
Therefore, selecting a drayage partner is not a commoditized decision; it’s a strategic one. You must vet partners on their ability to guarantee asset availability and navigate terminal complexities. A proactive partner with strong relationships and a robust plan for peak season can be the difference between a seamless operation and cargo stranded at the railyard.
Your Vetting Checklist: Selecting a High-Performance Drayage Partner
- Terminal Performance: Ask for their average turn time at your key destination railyards during peak periods to gauge their real-world efficiency.
- Chassis Guarantee: Inquire how they guarantee chassis availability, especially during peak season or known shortage events. What is their contingency plan?
- Operational Control: Determine if they are asset-based or non-asset-based. What level of control do they have over their drivers and equipment to ensure service reliability?
- Disruption Protocol: What is their exact communication protocol when a service disruption occurs, such as a missed cut-off, terminal congestion, or a chassis split?
- Fee Management: Clarify their policies for handling detention and demurrage fees, particularly those caused by driver wait times at congested terminals.
How to Load a Container for Rail to Prevent Damage from Shunting?
While OTR trucking involves relatively smooth, continuous motion, rail transport introduces unique and powerful forces that can damage improperly secured cargo. The most significant of these is shunting, also known as « humping. » This is the process where rail cars are sorted by being pushed over a small hill and allowed to roll and couple with other cars. The resulting impacts can be severe, creating both longitudinal and lateral forces far greater than those experienced on a highway. For a logistics manager shipping high-value automotive parts, ensuring load integrity against these forces is non-negotiable.
Standard blocking and bracing techniques sufficient for truckload may not be adequate for intermodal rail. The key is to create a tight, cohesive load that cannot shift in any direction. This often requires specialized dunnage, such as pneumatic bags that inflate to fill voids, steel racking systems for heavy components, and high-tensile strapping. As the Union Pacific Railroad states in its safety guide, the responsibility for this lies with the shipper.
Items must be properly secured in place or tied down so the load doesn’t spill, topple over or shift during transit. Failure to load a rail car correctly can cause unsafe conditions for the workers who unload the cars.
– Union Pacific Railroad, Rail Car Loading Safety Guide
The illustration below highlights how specialized dunnage is used to secure heavy, high-value components, preventing movement during transit and protecting them from the unique stresses of rail transport.

As the image demonstrates, every point of contact is engineered to absorb shock and prevent oscillation. The goal is to make the cargo an integral part of the container, moving as a single unit. Investing in proper dunnage and loading protocols is not an expense; it’s an insurance policy against product damage, costly claims, and production line disruptions.
Truck vs. Train: How Much CO2 Do You Actually Save per Ton-Mile?
The environmental benefit of shifting freight from truck to rail is one of the most compelling arguments for intermodal transport. However, for a logistics manager building a business case, vague claims of « being greener » are insufficient. The key is to quantify the savings to understand the true carbon arbitrage opportunity. The efficiency difference between the two modes is not marginal; it’s an order of magnitude, rooted in the fundamental physics of steel wheels on steel rails.
A freight train experiences significantly less rolling resistance than a truck’s rubber tires on pavement, allowing a single locomotive to move a massive amount of tonnage with far less energy. The precise numbers are stark. According to 2018 federal transportation data analyzed by Third Way, rail emits 0.048 pounds of greenhouse gases (GHG) per ton-mile, whereas trucking emits 0.465 pounds. This means rail is nearly ten times more efficient from a GHG emissions perspective. This isn’t a small optimization; it’s a structural shift in environmental impact.
For a shipment of 40,000 pounds traveling 1,500 miles, the math is clear. A truck would generate approximately 13,950 pounds of CO2 for the journey. The same shipment moved by rail would generate only about 1,440 pounds of CO2. Even when factoring in the first and last-mile drayage, the overall reduction remains substantial, often in the range of 60-70%. This level of quantifiable reduction allows logistics managers to meet and exceed corporate sustainability goals, providing a powerful data point for ESG (Environmental, Social, and Governance) reporting. The decision to use intermodal becomes not just a cost-saving measure, but a measurable contribution to the company’s environmental commitments.
The Scheduling Mistake That Leaves Your Cargo Stuck at the Railyard
The most common and costly scheduling mistake in intermodal logistics is assuming that equipment—specifically the container and the chassis—will be co-located and ready for a single, seamless pickup. This oversight ignores the operational reality of modern railyards, where chassis shortages and « split » equipment are rampant. Failing to plan for this reality is the primary reason cargo gets stuck, leading to missed appointments, angry customers, and costly detention fees. The core of the problem is a failure of asset synchronization.
In an ideal world, a drayage driver arrives at the railyard, hooks up to a chassis, and immediately mounts the designated container onto it before departing. In reality, the container might be in one part of the yard while the very limited pool of available chassis is in another, or even at a different terminal entirely. This forces the driver into a time-consuming hunt for equipment, a problem that is dramatically amplified during peak seasons.
This isn’t a minor inconvenience; it’s a capacity killer. A case study on Chicago’s intermodal operations provides a stark example of this breakdown in asset synchronization.
Case Study: The Crippling Effect of Chassis Shortages in Chicago
During a period of severe chassis shortages, drayage drivers in the Chicago market faced a logistical nightmare. A driver assigned a container at one terminal would often find no available chassis, forcing them on a 60-mile round trip to retrieve a chassis from another facility before returning to pick up the original container. This repositioning effort alone consumed up to 2 hours of the driver’s federally regulated 11-hour daily driving limit. For drivers handling multiple shipments, this meant that chassis repositioning could consume up to 50% of their available capacity, effectively halving their productivity and requiring twice the number of drivers to move the same volume of freight.
The strategic solution is proactive communication and planning with your drayage partner. You must confirm not only that the container is available but also that a specific, operational chassis is reserved and accessible. A sophisticated partner will use technology to track chassis pools in real-time and have contingency plans to mitigate the impact of these inevitable operational hurdles.
When to Use 53-foot Containers: The Density Calculation That Saves Money?
While the 40-foot container is the global standard for ocean freight, in the domestic U.S. intermodal market, the 53-foot container reigns supreme. For a logistics manager, choosing the right container size isn’t just about fitting the cargo; it’s a strategic decision based on a critical trade-off between weight and volume. Mastering this density optimization calculation is key to maximizing cost-efficiency on every load. The goal is to get as close as possible to the container’s limit, whether that’s its maximum weight capacity or its maximum internal volume.
Freight is typically categorized in two ways: freight that « weighs out » and freight that « cubes out. » * Weighing Out: This occurs with dense, heavy cargo like automotive engine blocks, transmissions, or raw materials. You will hit the legal weight limit (typically around 42,000-44,000 lbs for intermodal) long before you fill the container’s physical space. For this type of cargo, a smaller 20-foot or 40-foot container is often more efficient. * Cubing Out: This happens with light, bulky items such as interior door panels, seats, or packaging materials. You will fill the entire volume of the container long before you reach the weight limit. This is where the 53-foot domestic container provides its greatest advantage, offering significantly more cubic capacity than its 40-foot counterpart.
Using a 53-foot container for dense cargo that weighs out is inefficient, as you are paying for unused space. Conversely, using a smaller container for bulky items means you can’t fit as much product, increasing your per-unit shipping cost. The following table breaks down the best use cases for common container sizes in an automotive context.
| Container Type | Internal Capacity | Weight Limit | Best Use Case (Automotive) | Cost Efficiency |
|---|---|---|---|---|
| 20-foot ISO | 1,172 cu ft | ~44,000 lbs | Heavy engine blocks, transmissions (weigh out) | High per-unit for dense cargo |
| 40-foot ISO | 2,390 cu ft | ~44,000 lbs | Mixed heavy parts, balanced load | Moderate flexibility |
| 53-foot Domestic | 3,489 cu ft | 42,000-44,000 lbs | Light, bulky parts (door panels, trim, seats) – cube out | Maximum for low-density freight |
As the comparative analysis shows, the strategic choice of container is a direct function of your product’s density. By analyzing your freight profile and selecting the container that allows you to maximize either weight or cube, you can significantly lower your overall transportation spend.
Air Freight vs. Sea Freight: Which Is Best for Heavy Transmission Batches?
While the primary focus for planned, long-haul domestic freight is the truck vs. rail decision, a strategic logistics manager must understand where intermodal fits within the entire spectrum of transport options, especially when disruptions occur. The question of « Air vs. Sea » for a batch of heavy transmissions highlights the critical trade-off between cost and speed. In a domestic context, this same logic applies when comparing planned intermodal against expedited truck or emergency air freight. The right choice depends entirely on the urgency and the cost of a potential production line shutdown.
Intermodal rail is the undisputed champion for cost-effective, planned movements where transit time is predictable and not hyper-critical. However, when a supplier delay or quality issue threatens to halt a manufacturing line, the cost of the freight becomes secondary to the multi-million dollar cost of the shutdown. In these emergency scenarios, the modal choice escalates rapidly from rail to expedited truck and, in the most dire situations, to air freight. Each step up the ladder brings a dramatic increase in speed and an exponential increase in cost.
The following table illustrates the stark choices a logistics manager faces when a batch of critical transmissions is needed to prevent a line-down situation. This demonstrates how planned intermodal serves as the cost-effective baseline, against which all emergency modes are measured.

| Transport Mode | Estimated Cost (Batch) | Transit Time | Use Case Scenario | Risk/Benefit |
|---|---|---|---|---|
| Planned Intermodal Rail | $4,000 | 5-7 days | Normal production schedule | Cost-effective, predictable |
| Expedited Truck | $12,000 | 2-3 days | Minor schedule pressure | 2-3x intermodal cost |
| Emergency Air Freight | $40,000 | 1-2 days | Line-down prevention | 10x cost, prevents multi-million $ shutdown |
This analysis of freight shipping modes clarifies intermodal’s role: it is the strategic foundation for routine, long-distance supply. It provides the cost and carbon savings that fund the occasional, and unavoidable, use of more expensive, faster modes. A resilient supply chain isn’t about choosing one mode; it’s about knowing when to strategically deploy each one.
The « Deadhead » Mistake That Wastes 30% of Your Fuel Budget
In logistics, a « deadhead » refers to a truck moving with an empty trailer. It is the single most inefficient activity in transportation, consuming fuel and driver hours without generating any revenue. While often associated with OTR trucking, deadheading is also a significant issue in intermodal drayage, particularly during chassis repositioning or when returning a container to the railyard. For a logistics manager, minimizing these empty miles is a direct lever for cutting costs and emissions, and the inherent efficiency of rail provides a compelling alternative.
The fuel efficiency gap between rail and truck is massive. Recent US freight transportation efficiency data reveals that freight trains can move one ton of goods approximately 470 miles on a single gallon of fuel. In contrast, a truck moves that same ton only 134 miles per gallon. This fundamental efficiency means that every mile of freight shifted from road to rail represents a significant reduction in fuel consumption and its associated cost. By converting a long-haul, round-trip truck lane into an intermodal move, you effectively eliminate the risk of a 1,000+ mile deadhead return journey for the truck.
Leading companies actively design their networks to combat this waste. By analyzing their entire freight network, they can identify opportunities for « backhauls » or « continuous moves » that transform an empty return trip into a revenue-generating one.
Case Study: Anheuser-Busch’s War on Empty Miles
Anheuser-Busch provides a powerful example of systemic deadhead reduction. The company implemented a comprehensive intermodal optimization strategy focused on eliminating empty miles across its vast distribution network. By analyzing routes and identifying backhaul opportunities for their carriers and private fleet, they converted what would have been empty return trips into loaded, efficient moves. This strategy not only slashed their overall fuel budget and mileage but also significantly reduced their environmental footprint. The focus was on turning every leg of a journey, including the drayage segments, into a productive part of the supply chain.
The lesson for logistics managers is clear: treating empty miles as an unavoidable cost of business is a strategic error. By leveraging intermodal for the long haul and optimizing drayage routes, you can systematically engineer waste out of your network.
Key Takeaways
- Intermodal success is dictated by operational execution, not just distance. Focus on mastering drayage, loading, and scheduling.
- The first and last mile are the most critical and volatile stages; a strong, well-vetted drayage partner is your most important asset.
- True cost efficiency comes from density optimization: use 53-foot containers for bulky freight that « cubes out » and smaller containers for dense cargo that « weighs out. »
How to Cut Supply Chain Emissions by 20% While Lowering Costs?
For decades, logistics managers have faced a difficult trade-off: cut costs or reduce emissions. Intermodal transportation fundamentally breaks this paradigm, offering a rare opportunity to achieve both simultaneously. By strategically shifting freight from road to rail, companies can unlock significant financial savings while making substantial, measurable progress toward their sustainability goals. The key is to move from a reactive, shipment-by-shipment decision to a systematic, network-wide optimization model.
The financial case is straightforward. On average, freight shipping analysis shows that intermodal can be 10-15% lower cost per mile compared to OTR trucking for long-haul lanes. These savings are driven by superior fuel efficiency and labor productivity. A single train, operated by a two-person crew, can move the equivalent of nearly 300 trucks, creating enormous economies of scale. When applied across thousands of shipments, these per-mile savings translate into millions of dollars returned to the bottom line.
Simultaneously, the environmental benefits are profound. As previously discussed, rail is significantly more carbon-efficient per ton-mile. The macro-level impact of this shift is substantial. Groundbreaking Argonne National Laboratory research demonstrates that a modest shift of just 4.1% of truck freight to rail could achieve a 4.4% net reduction in total freight emissions. Implementing a successful intermodal strategy follows a clear, four-step process:
- Data Audit: Analyze all shipping lanes over 750 miles, documenting current volumes, costs, and transit times to establish a baseline for potential intermodal conversion.
- Candidate Scoring: Filter these lanes based on cargo weight, value, time-sensitivity, and volume consistency to identify the top 20-30% of freight best suited for a rail solution.
- Pilot Program: Test a single, low-risk lane with predictable volume. Use this pilot to establish reliable performance metrics for cost, transit time, and carbon reduction in your specific network.
- Scale & Measure: Systematically roll out the program to other qualified lanes while continuously tracking KPIs to demonstrate ROI and sustainability impact to senior leadership.
By adopting this strategic and data-driven approach, you can transform your transportation network from a simple cost center into a source of competitive advantage. The first step is to audit your highest-volume long-haul lanes and identify the single best candidate for your intermodal pilot program.